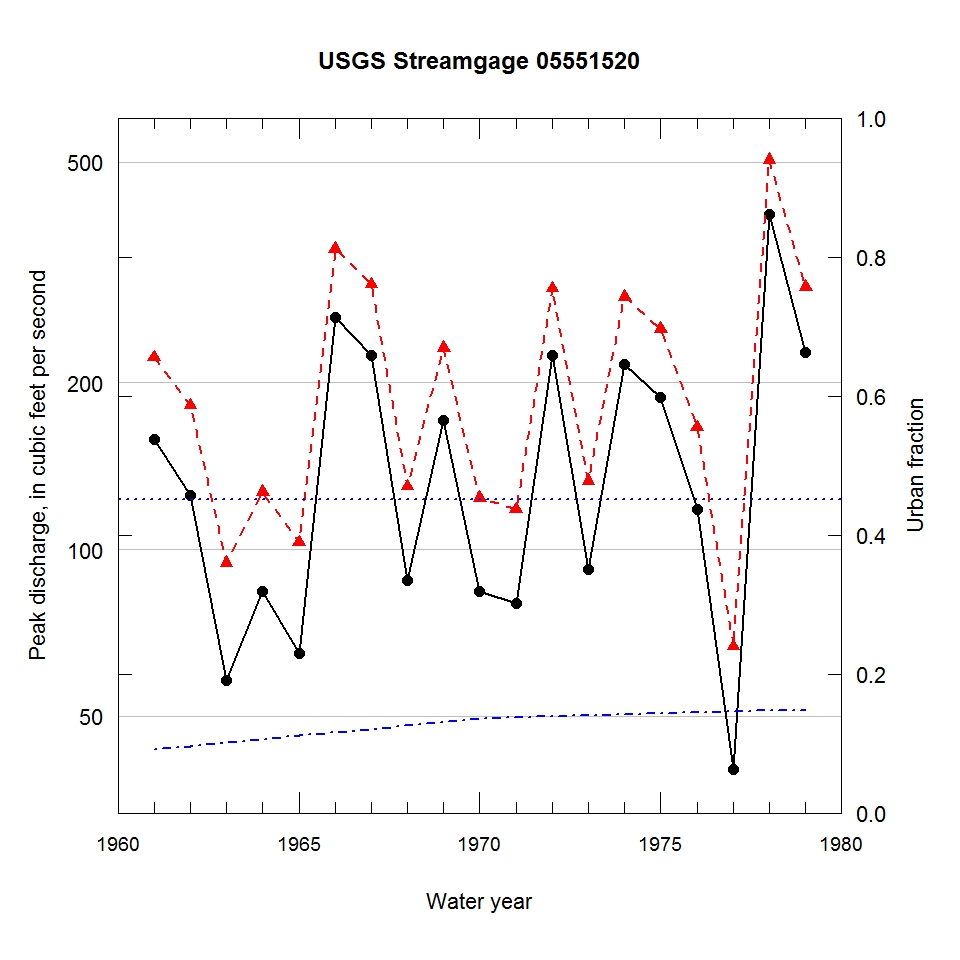
Observed and urbanization-adjusted annual maximum peak discharge and associated urban fraction and precipitation values at USGS streamgage:
05551520 INDIAN CREEK NEAR NORTH AURORA, IL


| Water year | Segment | Discharge code | Cumulative reservoir storage (acre-feet) | Urban fraction | Precipitation (inches) | Observed peak discharge (ft3/s) | Adjusted peak discharge (ft3/s) | Exceedance probability |
| 1961 | 1 | -- | 0 | 0.091 | 1.696 | 158 | 222 | 0.226 |
| 1962 | 1 | -- | 0 | 0.096 | 0.379 | 125 | 182 | 0.378 |
| 1963 | 1 | -- | 0 | 0.101 | 1.876 | 58 | 95 | 0.828 |
| 1964 | 1 | -- | 0 | 0.106 | 2.703 | 84 | 127 | 0.662 |
| 1965 | 1 | -- | 0 | 0.111 | 0.139 | 65 | 103 | 0.791 |
| 1966 | 1 | -- | 0 | 0.116 | 2.300 | 262 | 349 | 0.057 |
| 1967 | 1 | -- | 0 | 0.121 | 2.505 | 224 | 301 | 0.090 |
| 1968 | 1 | -- | 0 | 0.126 | 1.316 | 88 | 130 | 0.649 |
| 1969 | 1 | -- | 0 | 0.131 | 1.698 | 171 | 231 | 0.201 |
| 1970 | 1 | -- | 0 | 0.136 | 1.565 | 84 | 124 | 0.683 |
| 1971 | 1 | -- | 0 | 0.137 | 0.384 | 80 | 118 | 0.712 |
| 1972 | 1 | -- | 0 | 0.139 | 6.066 | 224 | 296 | 0.094 |
| 1973 | 1 | -- | 0 | 0.140 | 1.211 | 92 | 133 | 0.633 |
| 1974 | 1 | -- | 0 | 0.141 | 1.402 | 216 | 286 | 0.108 |
| 1975 | 1 | -- | 0 | 0.143 | 1.791 | 188 | 250 | 0.166 |
| 1976 | 1 | -- | 0 | 0.144 | 1.156 | 118 | 166 | 0.456 |
| 1977 | 1 | -- | 0 | 0.146 | 1.490 | 40 | 67 | 0.929 |
| 1978 | 1 | -- | 0 | 0.147 | 5.213 | 402 | 505 | 0.017 |
| 1979 | 1 | -- | 0 | 0.148 | 0.544 | 227 | 298 | 0.093 |

